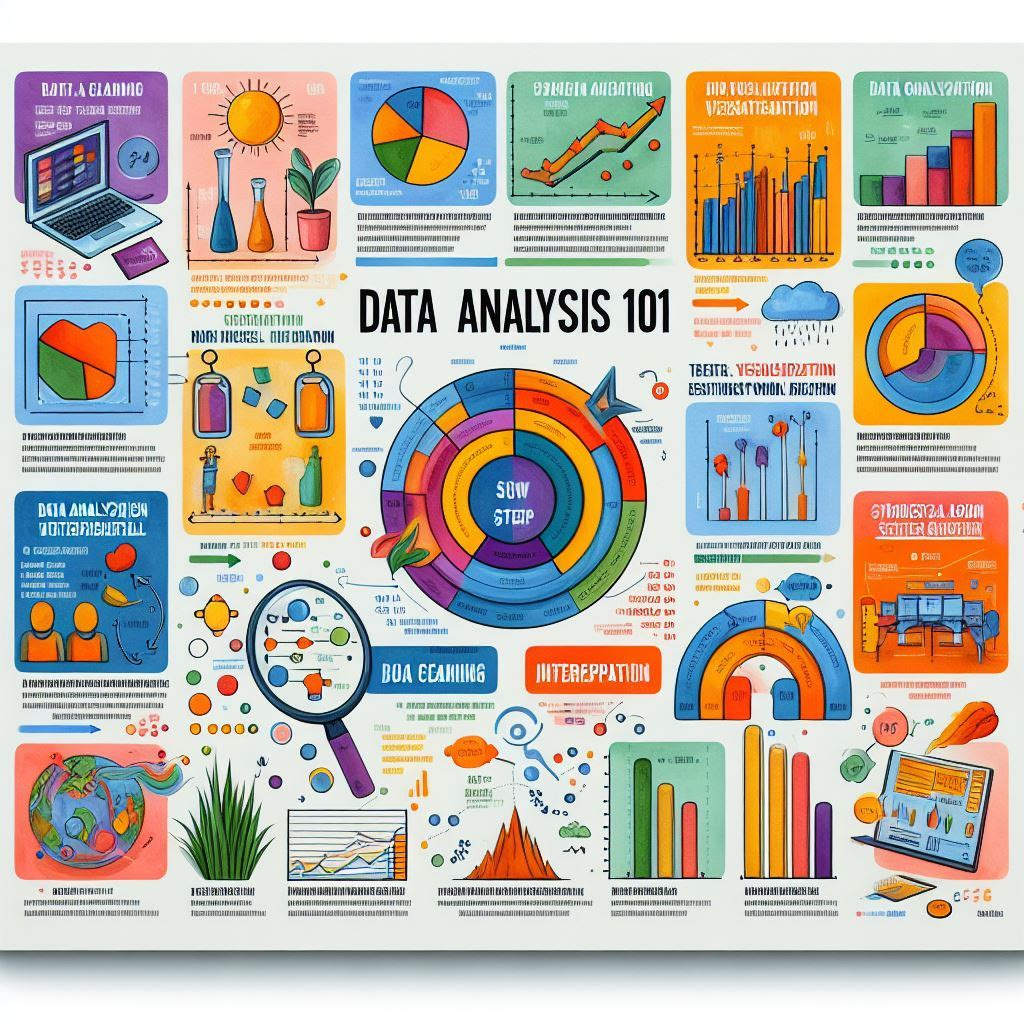
Explore the fundamentals of simple statistical analysis in data analytics : standard deviation with the aid of graphs.
What is Correlation Coefficient
The correlation coefficient is a statistical measure that describes the degree to which two variables change together. It quantifies the strength and direction of a linear relationship between two sets of data. The value of the correlation coefficient ranges between -1 and 1:
- A correlation coefficient of 1 indicates a perfect positive linear relationship.
- A correlation coefficient of -1 indicates a perfect negative linear relationship.
- A correlation coefficient of 0 indicates no linear relationship between the variables.
Use Cases of Correlation Coefficient in E-commerce Business:
-
Product Recommendations:
- Correlation analysis can help e-commerce businesses understand which products are frequently bought together. For instance, if customers who buy a particular type of smartphone also tend to buy phone cases or screen protectors, these items can be recommended together to increase sales.
-
Inventory Management:
- Understanding correlations between product sales can help businesses optimize their inventory management. Products that are positively correlated in sales can be stocked together to ensure availability, while negatively correlated products may be stocked in different locations or in different quantities.
-
Marketing and Promotions:
- Correlation analysis can identify relationships between marketing efforts (e.g., email campaigns, social media ads) and sales performance.
- Correlation analysis can identify relationships between marketing efforts (e.g., email campaigns, social media ads) and sales performance.
-
Price Optimization:
- Correlation analysis can help businesses understand how changes in product prices affect sales volumes.
Now let's do some hands-on practice using the Mock Data attached to this article :
We are using a sample data of an E-Comm firm operating in India and below is a Snap shot of the data.
Fig. 1 : Snapshot of the Data in .CSV file
Steps to calculate the Correlation Coefficient and analyse the output
Step 1
Login in to your Free Talktodata.AI account and upload the data set. Below is the screenshot for reference.
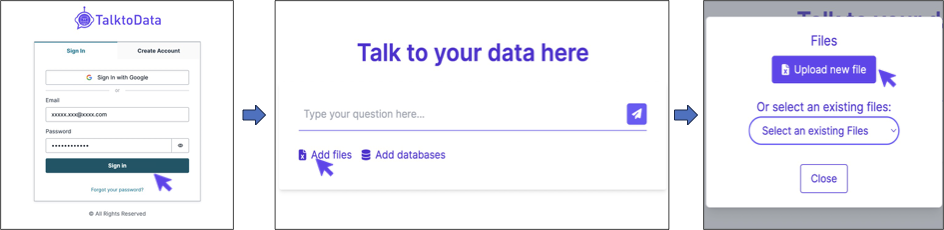
Fig.2 : Steps to Login and Upload the sample data file
Step 2:
Asking the Tool to perform the Analysis. For example, i'm using the command
"Do Correlation analysis on Qty and Amount columns"
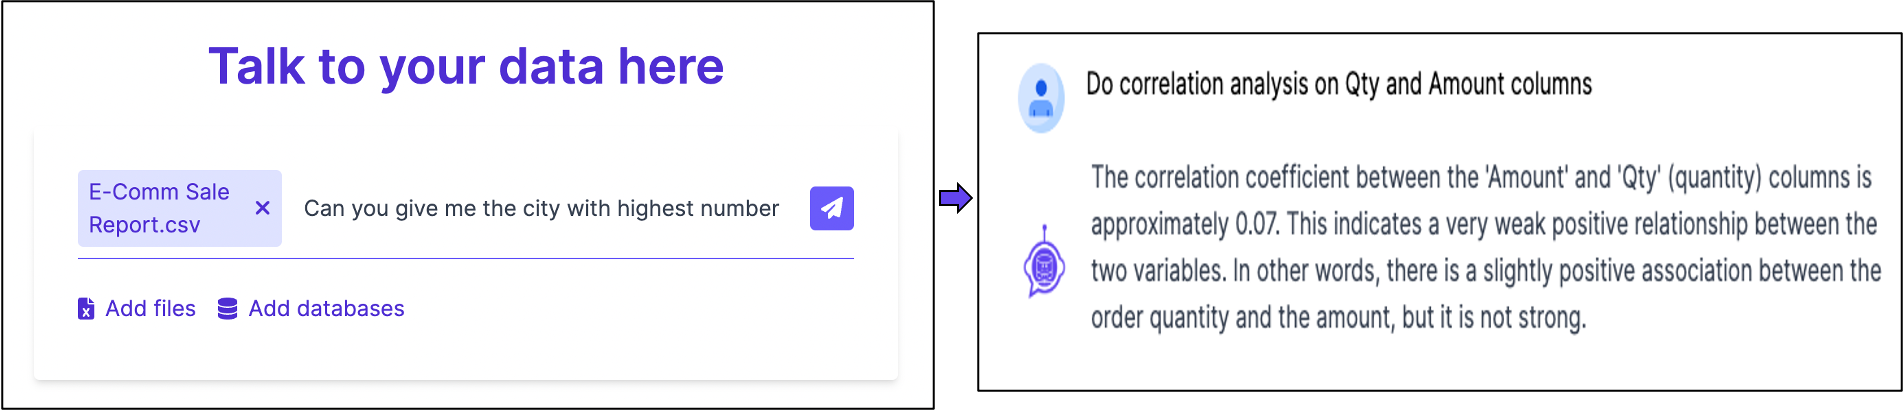
Fig. 3: Asking the Query
Its imporatant to understand the result derived from this analysis and also how it can be utilised for your decision making. In this example, a correlation coefficient of 0.07 indicates that there is no linear or direct relation ship between these values and rightly so.
We are looking at correlation between the order quantities and the costs in case of an e-comm sales cart in a particular category where the Max value is ~5584, avg is ~644 and median value is ~599. This clearly indicates that the purchase decisions or order quantity were not influenced by the price.
If in the same example, given the right data, if we compare price sensitive purchases during and after a sale, this value will be much more impactful.
There you have your Correlation values Calculated in less than a minute. To ensure accurate results, it's important for us to ask the right questions.
Here is a simple guide on how to ask the right questions
You can further enhance this visualisation by asking the assistant to add data tags, change graph colours, add an average line etc. Now go-ahead and start your AI Assisted Data Analytics Journey.
Click here to Download the sample data set.
For any queries or support, please visit https://talktodata.ai/
