Explore the fundamentals of simple statistical analysis in data analytics : standard deviation with the aid of graphs.
What is Standard Deviation and what are its uses
Standard deviation is a measure of the amount of variation or dispersion in a set of values. It provides insight into the spread or distribution of data points in a dataset. A low standard deviation indicates that the data points tend to be close to the mean (average) of the set, while a high standard deviation indicates that the data points are spread out over a wider range of values.
Standard deviation has various real-life business applications across different industries. Here are some specific use cases where standard deviation plays a crucial role:
-
Stock Market Analysis:
- Volatility Measurement: Investors and analysts use standard deviation to measure the volatility or risk associated with a particular stock or portfolio of stocks. A higher standard deviation of stock returns indicates greater price variability and risk.
-
Sales Forecasting and Demand Planning:
- Sales Variability: Standard deviation is used to analyze the variability in sales data over time. It helps businesses understand the demand fluctuations, seasonality, and trends in sales, which is essential for inventory management, production planning, and budgeting.
-
Quality Control and Manufacturing:
- Product Quality: Standard deviation is used in manufacturing to monitor and control the quality of products by measuring the variability in product dimensions, specifications, or performance metrics.
-
Customer Satisfaction and Service Quality:
- Service Performance: Businesses use standard deviation to analyze customer feedback, satisfaction scores, and service quality metrics (e.g., response time, resolution time) to identify areas for improvement, address customer concerns, and enhance the overall customer experience.
-
Human Resources and Employee Performance:
- Performance Appraisal: HR managers and supervisors use standard deviation to evaluate employee performance, productivity, and contribution to organizational goals. It helps them identify top performers, address performance issues, and make informed decisions on promotions, bonuses, and career development.
Now let's do some hands-on practice using the Mock Data attached to this article :
We are using a sample data of an E-Comm firm operating in India and below is a Snap shot of the data.
Fig. 1 : Snapshot of the Data in .CSV file
Steps to calculate the Correlation Coefficient and analyse the output
Step 1
Login in to your Free Talktodata.AI account and upload the data set. Below is the screenshot for reference.
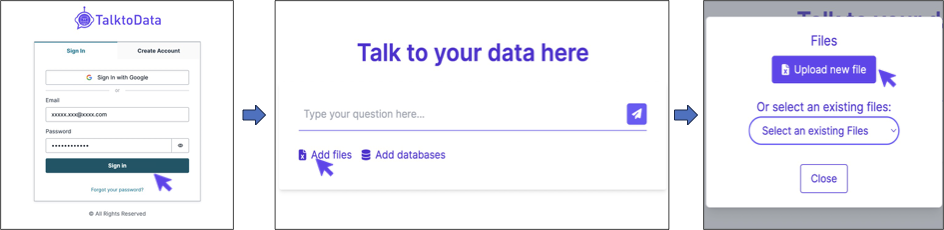
Fig.2 : Steps to Login and Upload the sample data file
Step 2:
Asking the Tool to perform the Analysis. For example, i'm using the command
"can you give me the standard deviation of monthly sales amount of all the shipped orders?"
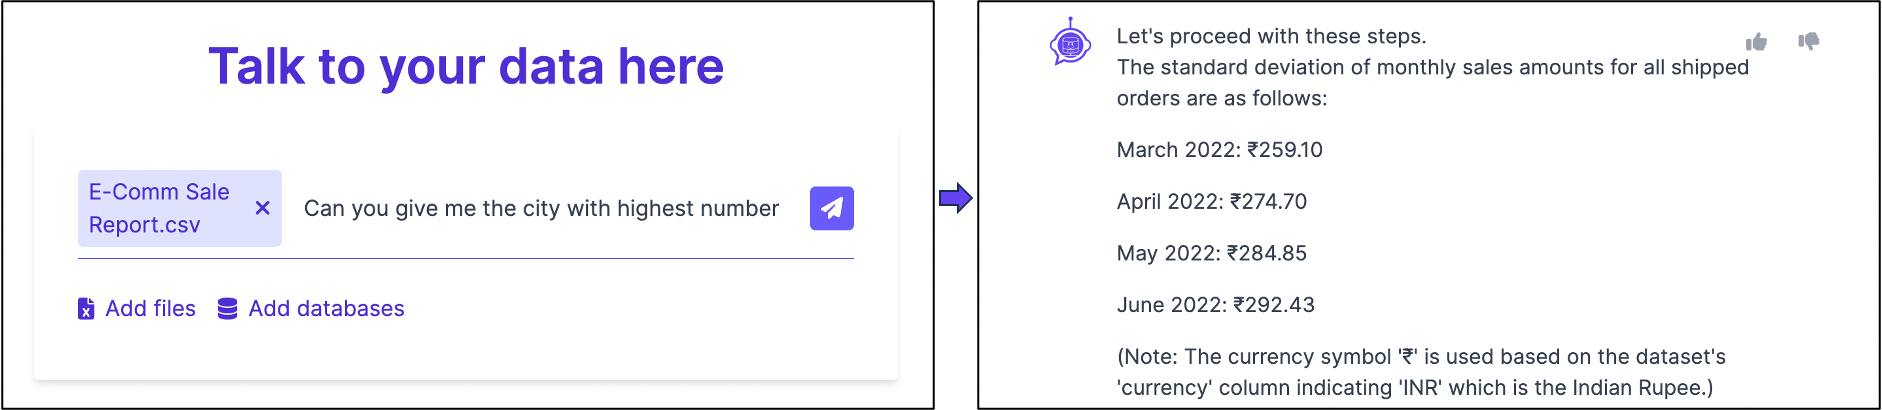
Fig. 3: Asking the Query
There you have your standard deviation values Calculated in less than a minute.To ensure accurate results, it's important for us to ask the right questions.
Here is a simple guide on how to ask the right questions
Now go-ahead and start your AI Assisted Data Analytics Journey.
Click here to Download the sample data set.
For any queries or support, please visit https://talktodata.ai/
