Explore the fundamentals of simple statistical analysis in data analytics, covering mean & median with the aid of graphs.
Understanding Mean and Median
In data analytics, understanding the concepts of mean and median is crucial. The mean, also known as the average, is calculated by summing up all the values in a dataset and dividing it by the total number of values. It provides a measure of central tendency and gives us an idea of the typical value in the dataset.
On the other hand, the median is the middle value in a dataset when it is arranged in ascending or descending order. It is a robust measure of central tendency that is not affected by outliers. By understanding the mean and median, we can gain insights into the distribution and characteristics of the data.
For example, if we have a dataset of sales transactions and we want to analyze the Average sale value and what is the media sale value for the past 6 months, we can slice the data to extract only the records for past 6 months and calculate these values. This allows us to analyze the average cart value, high ticket item sales etc.
Now let's do some hands-on practice using the Mock Data attached to this article :
We are using a sample data of an E-Comm firm operating in India and below is a Snap shot of the data.
Fig. 1 : Snapshot of the Data in .CSV file
Steps to calculate the Mean & Median
Step 1:
Login in to your Free Talktodata.AI account and upload the data set. Below is the screenshot for reference.
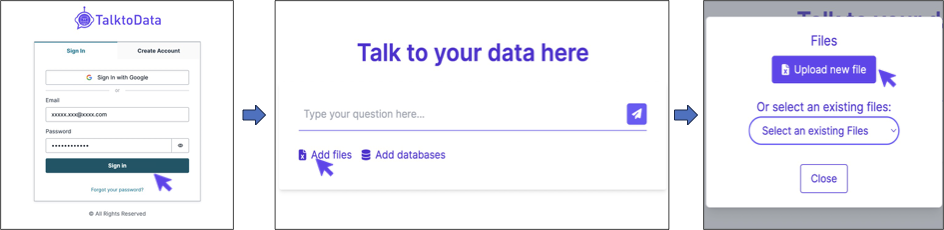
Fig.2 : Steps to Login and Upload the sample data file
Step 2:
Asking the Tool to perform the Analysis. For example, i'm using the command
"Can you give me the Mean and Median Sales Amount for all shipped orders state wise?"
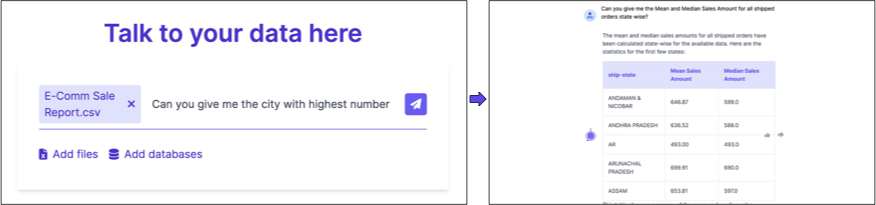
Fig. 3: Asking the Query
Step 3:
Now you can choose from the list of suggested questions or enter questions for further analysis. In this tutorial, we are going to see how we can get the data Visualisation based on our previous result.
Here i'm using the command
"Plot a line graph capturing the mean & median amounts for 10 states"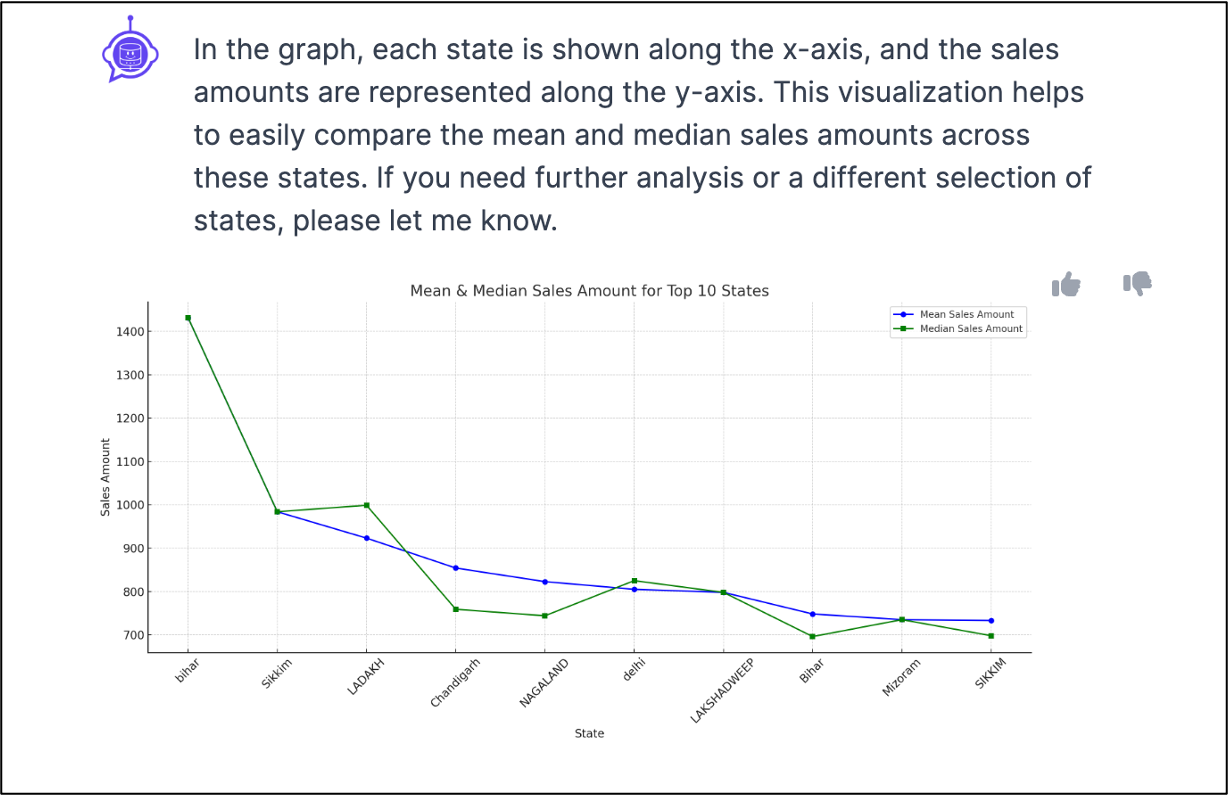
There you have your graph with mean & media values Calculated in less than a minute. To ensure accurate results, it's important for us to ask the right questions.
Here is a simple guide on how to ask the right questions
You can further enhance this visualisation by asking the assistant to add data tags, change graph colours, add an average line etc. Now go-ahead and start your AI Assisted Data Analytics Journey.
Click here to Download the sample data set.
For any queries or support, please visit https://talktodata.ai/
