Explore the fundamentals of simple statistical analysis in data analytics, covering classification of data with the aid of graphs.
Understanding Time Series Analysis - Seasonality
Time-Series Analysis is a statistical method used to analyze and interpret data points collected or recorded over a period of time. It aims to identify patterns, trends, and relationships within the data to make predictions or forecasts for future time points.
Seasonality is one of the elements in Time-Series Analysis, which refers to the repetitive and predictable patterns that occur at regular intervals within a time series data. These patterns can be daily, weekly, monthly, or yearly and are often influenced by seasonal factors such as weather, holidays, or cultural events. Identifying and accounting for seasonality is crucial in time-series analysis as it can significantly impact the accuracy of forecasts and predictions.
Now let's do some hands-on practice using the Mock Data attached to this article :
We are using a sample data of an E-Comm firm operating in India and below is a Snap shot of the data.
Fig. 1 : Snapshot of the Data in .CSV file
Steps to perform Time-Series (Seasonality) Analysis
Step 1:
Login in to your Free Talktodata.AI account and upload the data set. Below is the screenshot for reference.
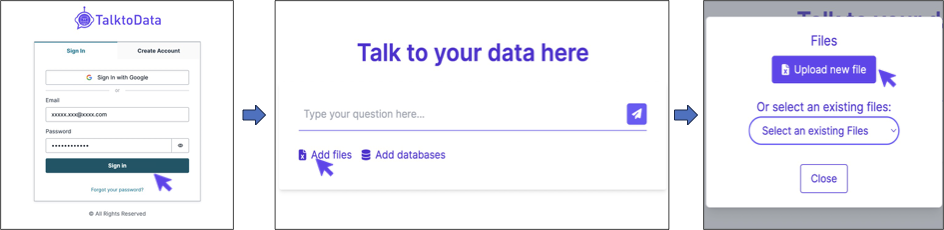
Fig.2 : Steps to Login and Upload the sample data file
Step 2:
Asking the Tool to perform the Analysis. For example, i'm using the command
"plot monthly order quantities?"

Fig. 3: Graph Output
Step 3:
Now lets analyse the graph. As we can see the sales have spiked during the months April and May. This may be a sign for seasonality, but with this limited data, this can't be concluded with confidence.
To ensure accurate results, it's important for us to ask the right questions.
Here is a simple guide on how to ask the right questions
You can further enhance this visualisation by asking the assistant to add data tags, change graph colours, add an average line etc. Now go-ahead and start your AI Assisted Data Analytics Journey.
Click here to Download the sample data set.
For any queries or support, please visit https://talktodata.ai/
